
Monthly ads report
Recipe. The month-end routine, with recommendations your team decides on.
The monthly ad report is a skill in Ai1, the AI agent platform by MyZone AI. It pulls spend, clicks, conversions and cost per result for each ad platform, sets them against what your analytics shows those visitors did, and builds a branded PowerPoint deck. You check it before it goes to a partner, client or board.
No dashboards to dig through
The month's results arrive as one deck instead of a login for each platform.
Numbers you can trace
Each figure comes from your own ad accounts and analytics, never from industry averages.
Brands kept apart
If you run more than one brand or client, each one gets its own report.
At a glance
| Covers | Google Ads, Microsoft Ads, Amazon Ads, and Facebook and Instagram |
|---|---|
| Shows | Reach, clicks, conversions, spend and cost per result, set against your analytics |
| Format | A branded PowerPoint deck |
| Figures from | Your own ad accounts and Google Analytics |
| Run by | The Google Ads Agent, the Media Buyer or the Meta Ads Agent |
| Never | Changes a budget, bid or ad |
Each ad platform counts results its own way, so three logins give you three different stories about the same month. Partners and clients want one answer: what the money bought. The report lines the platforms up side by side, checks them against what your analytics recorded, and says in plain words what the numbers mean.
How this differs from the weekly search term clean-up by the Google Ads Agent: the clean-up hunts for wasted searches every week; the report sums up the whole month across every platform.
How it works
Four steps. The deck comes to you before anyone else sees it.
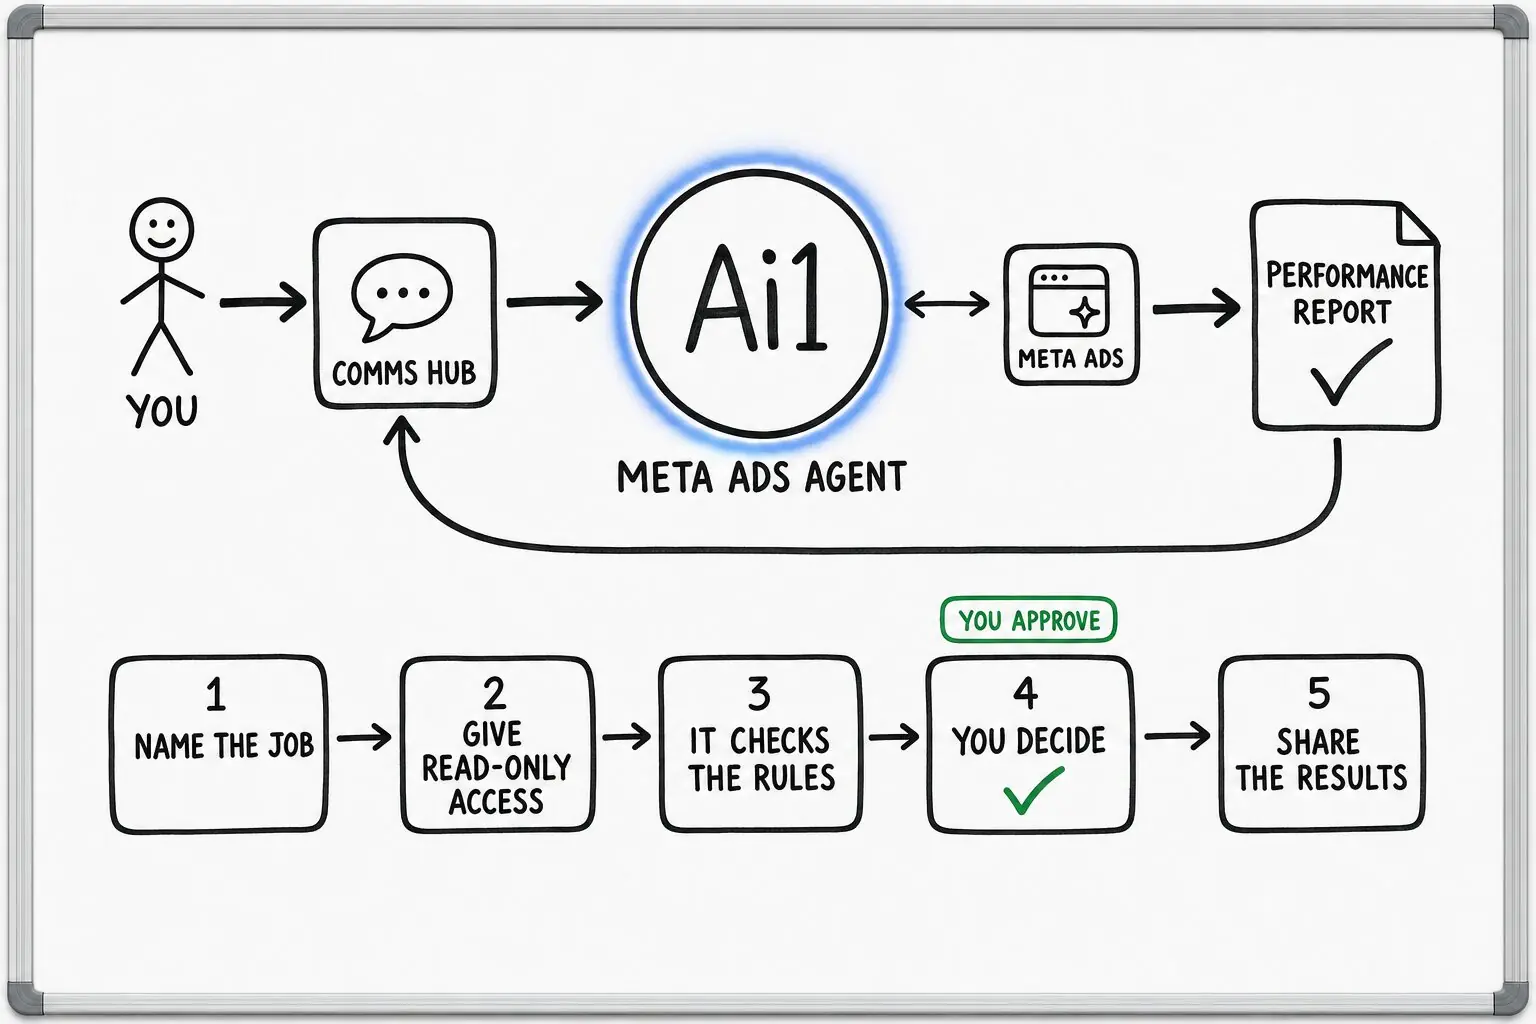
Ask for last month's report, for one brand or for each client you look after.
Spend, clicks and conversions come from each ad account, and the results from Google Analytics.
The figures go into a branded PowerPoint deck with a plain account of what they mean for you.
The report comes to you for sign-off before it counts as approved or goes to anyone else.
Example monthly ad report
Example with a fictional company. Names and figures are invented to show the kind of output you get.
What it was asked: Can I get September's ads report for the partners, covering Google and Microsoft Ads?
| Spend | $5,420 across Google Ads and Microsoft Ads in September. |
|---|---|
| Results | 112 new-patient enquiries at $48 each, down from $55 in August, with Google Analytics showing 97 of them booked online. |
| What it means | In plain words: most of the gain came from emergency appointment searches on Google; Microsoft brought fewer enquiries, at a lower cost each. |
| For the partners | Ready to send once the practice manager has checked it. |
Built-in guardrails
How the monthly ad report stays accurate and leaves your accounts alone.
Better together
Where this report fits, and the skills around it.
Recipe. The month-end routine, with recommendations your team decides on.

Agent. Answers spend questions between reports.
Skill. Sets the direction before money is spent.
Skill. Checks the conversions in the report are still being counted.
Common questions
Spend, clicks, conversions and cost per result for each ad platform, set against what your analytics shows those visitors did, with what the numbers mean for you. It arrives as a branded PowerPoint deck.
The Media Buyer reports on Google, Amazon and Microsoft Ads with your Google Analytics results. The Google Ads Agent writes the Google Ads report, and the Meta Ads Agent writes the monthly report for Facebook and Instagram from your Meta ad account.
Yes. Each client's data is kept completely separate, so one account's spend or analytics never appears in another's report.
No. It reads your accounts view-only. If the numbers point to a change, a person on your team decides and makes it.
We will build the monthly ad report from your own accounts and walk you through it.