I want to ask you a question, and I want you to be honest with yourself. When was the last time you actually researched what your competitors are charging? Not guessed. Not assumed based on a proposal you saw two years ago. Actually researched it.
What about industry trends? Do you know the current AI adoption rate among businesses your size? Do you know which of your service lines is riding a wave versus fighting a current?
If you’re like most small business owners I work with, the honest answer is: you don’t know. And it’s not because you don’t care. It’s because nobody has time. You’re running the business. There’s no research department. There’s no competitive intelligence team. There’s just you, your gut, and whatever you happened to hear at the last conference.
That’s the intelligence gap. And it’s costing you more than you think.
The Intelligence Gap Nobody Talks About
Fortune 500 companies spend millions on competitive intelligence. They have dedicated teams tracking competitor moves, industry trends, pricing dynamics, and technology shifts. They have subscriptions to analyst firms. They have strategy consultants producing quarterly market assessments. Every strategic decision they make is informed by data.
Small businesses have none of that. They make the same types of strategic decisions — which markets to enter, what to charge, where to invest, when to pivot — but they make them with almost zero external intelligence. They’re flying blind.
The conventional wisdom has always been that this is just the cost of being small. You can’t afford a research analyst. You can’t justify $50,000 a year for market intelligence subscriptions. So you make do with gut instinct and hope for the best.
But here’s what changed: AI made it possible to build a Strategic Command Center for a fraction of the cost. Not a watered-down version. The real thing. Monthly analyst-grade reports with citations, cross-domain synthesis, and actionable recommendations. For less than the cost of a part-time intern.
What a Strategic Command Center Actually Looks Like
When I describe this to business owners, their first reaction is usually scepticism. “AI research” sounds like it means ChatGPT with a fancy prompt. It’s not. What we’ve built is a genuine research engine that runs on a schedule, produces structured reports, cites every claim, and delivers them to your leadership team automatically.
Here’s what it actually does. Every month, the system produces four deep research reports — each one 5,000 to 8,000 words, with inline citations and source lists. These aren’t summaries from a chatbot. They’re structured intelligence documents produced by Perplexity’s deep research model, which scans thousands of sources, synthesises findings, and produces reports with the rigour of a junior research analyst.
Between those monthly deep dives, the system runs daily and weekly web scans using Brave Search and Claude, monitoring for breaking news, competitor announcements, and industry developments. Think of it as having a research assistant who reads everything, every day, and flags what matters.
And at the end of each month, all four reports feed into a consolidated strategic briefing that cross-references findings across domains. That’s where the real magic happens — because a pricing shift only makes sense when you see it alongside a competitor move and an industry trend.
The Four Intelligence Pillars
The system is built around four research pillars, each designed to answer a specific strategic question.
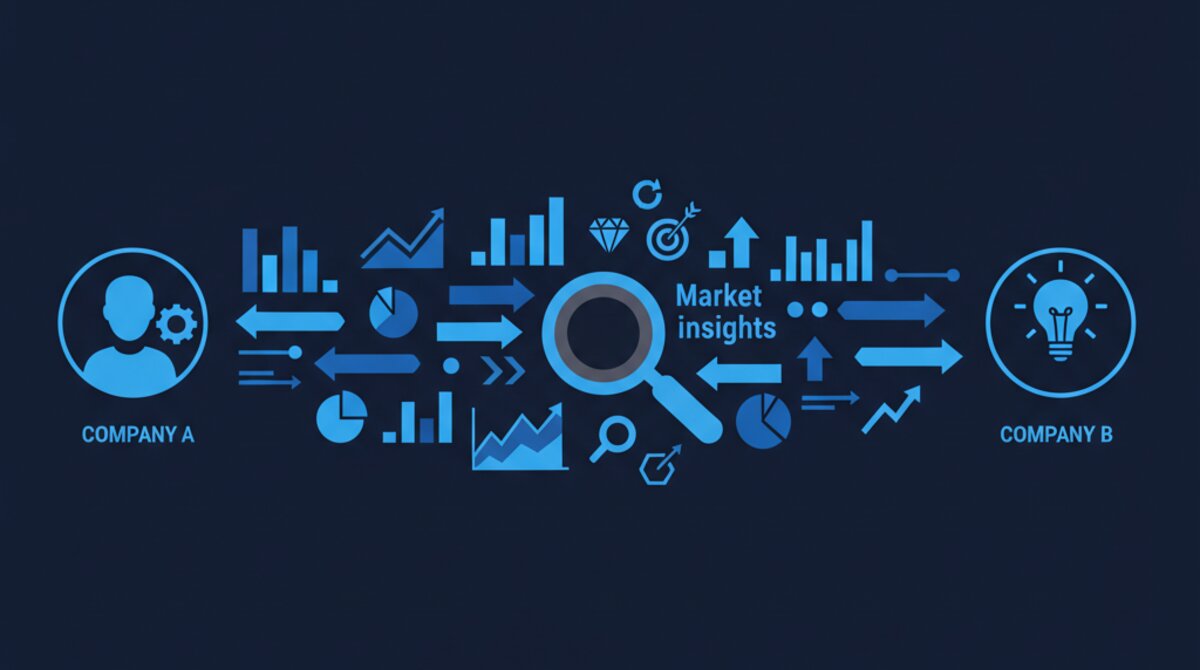
Competitive Analysis answers: who are we competing against and what are they doing? For each of your service lines, AI identifies and profiles 3 to 5 direct competitors at a similar scale. Not the Accentures and McKinseys of the world — those aren’t your competitors. The boutique agencies and independent operators who are actually fighting for the same clients. The system tracks their new offerings, partnerships, pricing changes, and content strategy on a monthly basis.
Industry Intelligence answers: what’s happening in our market? Market size estimates, growth rates, technology shifts, regulatory changes, and demand signals across every vertical you serve. The system produces a market health scorecard — growing, stable, or declining — for each vertical, plus a 6 to 12 month trend outlook.
Pricing Benchmarks answers: are we charging the right amount? Market rate analysis across all your service categories, with regional breakdowns where data is available. This is the report that typically makes business owners most uncomfortable — because they almost always discover they’re undercharging in at least one area.
AI Adoption Tracking answers: where is demand heading? Current adoption rates by industry and company size, spending trends, barriers to adoption, workforce readiness data, and tool platform shifts. This directly informs which services will be in demand six months from now and where to position your offerings.
How the Research Engine Works (The Plumbing)
I’m going to get technical for a minute because I think it matters. When people hear “AI research,” they imagine someone typing a question into ChatGPT. This is fundamentally different.
The research engine runs as a fully automated pipeline. A cron job fires on a schedule. A bash script handles the entire workflow: it loads the research prompt for that category, calls the Perplexity API with the deep research model, parses the response, converts it to a formatted document, uploads it to Google Drive, logs the cost, and posts a summary to the relevant Slack channel. Zero human intervention. Zero LLM tokens wasted on orchestration. The pipeline is deterministic — the same input always produces the same workflow.
The research prompts themselves are carefully engineered templates. The competitive analysis prompt, for example, specifies exactly what to research per service line: competitor discovery, detailed profiles, market dynamics, cross-service-line threats, self-service platform risks, and strategic recommendations. It tells the model to target 5,000 to 8,000 words and to cite every factual claim.
Between monthly deep dives, daily web scans use a different model — Brave Search for the queries, Claude Opus 4.6 for the analysis. This catches breaking news and emerging signals that can’t wait for the monthly cycle.
All reports are deposited in organised Google Drive folders and posted to dedicated Slack channels — one channel per intelligence pillar. Your leadership team gets the research delivered where they already work, without needing to log into another dashboard.
From Raw Research to Strategic Action
Having four separate intelligence reports is valuable. Having them synthesised into a single strategic briefing is transformative.
On the 25th of each month, the consolidation engine runs. It takes all four monthly reports, identifies cross-cutting themes, and produces a unified strategic briefing with a market scorecard covering competitive position, industry momentum, pricing power, and AI readiness.
This is where patterns emerge that no single report could reveal. A competitor lowering prices might seem like a threat in isolation. But when you see it alongside an industry report showing that segment is declining, it becomes a signal to exit, not a prompt to match their price cut. Or an AI adoption spike in healthcare might seem like someone else’s opportunity — until the pricing report shows that healthcare AI consulting rates are 40% above the market average.
The consolidated briefing always ends with a prioritised action plan: the top five things your leadership team should do this month, grounded in specific findings from across all four pillars. Not vague strategic advice. Specific recommendations with rationale and suggested timelines.
The Cost of Not Knowing
Let me make this concrete. I’ve seen three patterns repeatedly in the businesses I work with.
First, pricing too low. In almost every engagement where we turn on the pricing intelligence pillar, we discover the client is undercharging in at least one service area. Not by a little — by 15 to 30 percent. They set their prices years ago based on what felt right and never updated them. Meanwhile, the market moved. For a company doing $2 million in revenue, a 15% pricing gap on even a third of their services represents $100,000 in unrealised revenue. Per year.
Second, missing market shifts. A competitor launches a new offering that directly competes with your flagship service. You find out three months later when a client mentions it. By then, the competitor has already won deals you didn’t even know you lost. With monthly competitive monitoring, you know within 30 days and can respond strategically.
Third, investing in the wrong things. Without industry and adoption data, you’re allocating resources based on past performance, not future demand. I’ve seen companies double down on service lines that were already declining because they had no forward-looking market data to tell them otherwise.
The cost of not knowing isn’t a number you’ll find in your P&L. It’s the revenue you never earned, the threats you didn’t see, and the opportunities that passed you by while you were busy running the business.
What This Means for a 20-Person Company
Let’s talk about what this actually looks like in practice for a company with 20 or so employees.
Every month, your leadership team receives four deep research reports plus a consolidated strategic briefing. Each report arrives in your Google Drive and gets summarised in a dedicated Slack channel. No new tools to learn. No dashboards to check. The intelligence comes to you.
The monthly cost for the Perplexity research API runs under $10 — four reports at roughly $0.50 each, plus daily scans at a penny or two. The daily web scans are effectively free. Compare that to the $3,000 to $8,000 per month you’d pay a research analyst, or the $50,000 or more per year for analyst firm subscriptions that are designed for enterprise companies anyway.
What you get is not a watered-down version of enterprise intelligence. You get the same four pillars — competitive, industry, pricing, adoption — with the same depth and citation standards. The difference is the delivery mechanism: AI instead of humans, automated instead of manual, monthly instead of whenever someone has time.
For a company running on EOS, these intelligence reports plug directly into your quarterly planning. Instead of setting rocks based on gut instinct, you set them based on market data. Instead of debating whether to raise prices, you look at the pricing benchmark report and see exactly where you stand relative to the market.
Where This Goes Next
The research engine is one layer in what we call the Strategy Automation Stack. It produces the external intelligence. The next layer — scorecard tracking — produces the internal intelligence. When you combine the two, something powerful happens.
Your balanced scorecard shows that revenue is 12% below target. The competitive analysis shows a new entrant is winning deals in your segment. The pricing report shows your rates are below market. Suddenly, the revenue gap has context. It’s not just a red number on a dashboard. It’s a story: a new competitor entered at lower prices, and you haven’t adjusted your positioning. The action plan writes itself.
That’s the vision. Internal data plus external intelligence, cross-referenced automatically, producing insights that would take a strategy team weeks to assemble. And it runs every month, without anyone having to lift a finger.
We’re building this stack piece by piece. The research engine is live. Scorecard tracking is live. Next comes deeper financial analysis and real-time competitive monitoring. Each layer makes the others more valuable.
Ready to Stop Flying Blind?
If you’re making strategic decisions without competitive intelligence, you’re not being bold. You’re being blind. And for the first time in history, the fix doesn’t require hiring a research team or subscribing to enterprise analyst platforms.
Book a consultation and we’ll show you exactly what the Strategic Command Center would look like for your business. We’ll profile your specific competitors, identify the intelligence gaps that matter most, and show you what monthly strategic briefings would contain. No obligation. Just clarity.
Because the businesses that win aren’t always the biggest. They’re the ones that know the most.
See the Deep Research Intelligence Automation in Action
Watch how Ai1 delivers competitive intelligence briefings with our deep research intelligence automation workflow.
Explore the Automation →